Reports & Dashboards Management
Reports & Dashboards
Generate reports, export quality data, and monitor performance through dynamic dashboards across the Live!QC Tools platform. Get the information you need in the right format with configurable reports and real-time data visualization.
Trusted by Quality-Driven Organizations








Connected Data.
Clear Insights.
Live!QC Tools brings reporting and dashboard capabilities across quality modules, helping teams generate reports, visualize data, and monitor performance from one centralized platform.
Configurable
Reports
Create reports using predefined templates with configurable headers, content, and footers to maintain consistent documentation.
Multiple Export
Options
Export module-specific reports in formats such as PDF and Excel based on your reporting requirements.
Real-Time
Dashboards
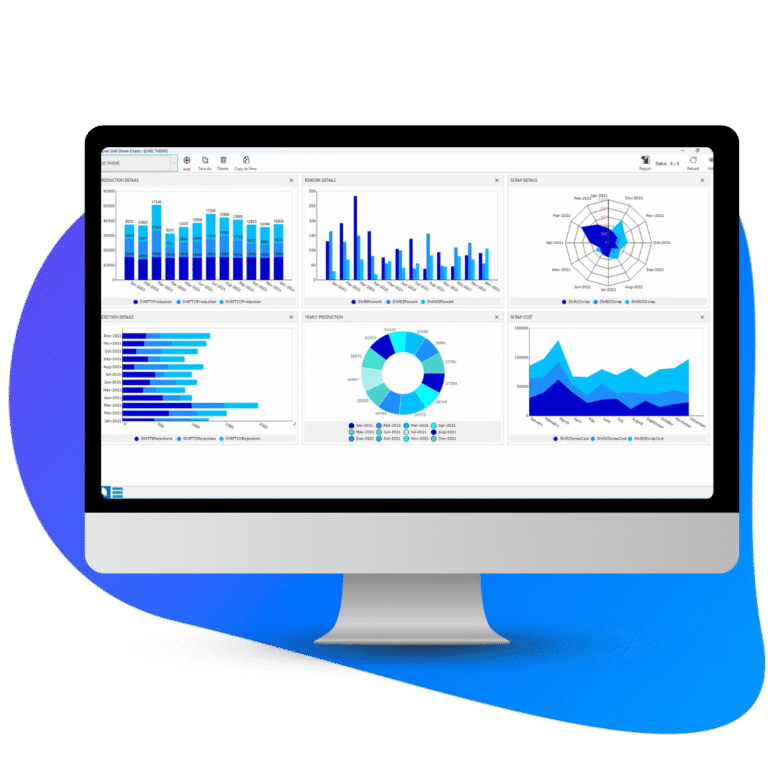
Monitor quality metrics through configurable, data-driven dashboards that update as new information is collected.
Smarter reporting and visibility, fully tailored to your workflow
Generate, export, visualize, and monitor quality data across Live!QC Tools through configurable reports and dynamic dashboards.
Module-Specific Reporting and Visualization
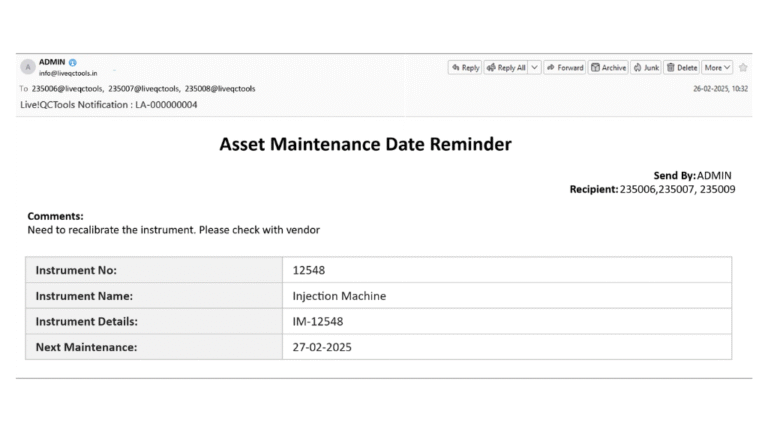
- Predefined Report Templates: Use configurable templates for consistent report generation.
- Custom Headers & Footers: Adapt report headers, content, and footers to your documentation requirements.
- Module-Specific Reports: Generate dedicated reports based on the active Live!QC Tools module.
- Structured Documentation: Maintain consistent reporting across internal reviews and customer-facing submissions.
- PDF Export: Generate reports in PDF format for documentation and sharing.
- Excel Export: Export data in Excel format for further analysis and processing.
- Module-Based Export: Access relevant export options based on the active module.
- Flexible Data Access: Choose the appropriate format for different reporting requirements.
- Real-Time Data Updates: Monitor quality metrics as new data is collected.
- Configurable Views: Tailor dashboard views, metrics, charts, and filters to your priorities.
- Module-Specific Dashboards: Access dashboards designed around different quality processes.
- Visual Quality Monitoring: Identify trends, performance areas, and pending activities through data visualization.
- NC & CAPA Monitoring: Track non-conformances, corrective actions, overdue tasks, and CAPA closure rates.
- Task Management: Monitor assignments, completion status, and deadlines.
- Audit Monitoring: Track audit completion and observation closures.
- Supplier & Defect Analysis: Visualize supplier performance, defect trends, and key quality indicators.
Got Questions? We’ve Got Answers
Live!QC Tools supports dedicated report generation for every active module in your environment — including Measurement System Analysis (Live!MSA), First Article Inspection (Live!FAI), 8D Problem-Solving (Live!8D), Non-Conformance (Live!NC), Corrective & Preventive Action (Live!CAPA), Audit Report (Live!Audit), FMEA Analysis (Live!FMEA), and Control Plan (Live!CP) reports, among others too.
Live!QC Tools provides dedicated report generation across modules such as MSA, First Article Inspection, 8D, Non-Conformance, CAPA, Audit, FMEA, and Control Plan.
Live!QC Tools dashboards are entirely data-driven and update in real time as soon as new data is collected, so your team always sees the latest quality metrics.
Yes. Every dashboard is fully configurable, letting you tailor views, metrics, chart types, and filters. Live!QC Tools also offers a suite of specialized dashboards - such as NC, CAPA, Task Management, Audit, Asset, Supplier Performance, and Defect Tracking dashboards - so each team sees exactly what matters to them.
Visualize. Analyze. Improve.
Live!QC Tools transforms quality data into actionable insights through configurable reports, real-time dashboards, and intelligent analytics -helping your teams monitor performance, identify trends, and make faster, data-driven quality decisions.